• Develop a stock picking algorithm in Python that gathers data on over 6000 stocks from NASDAQ and NYSE and determines which ones to buy
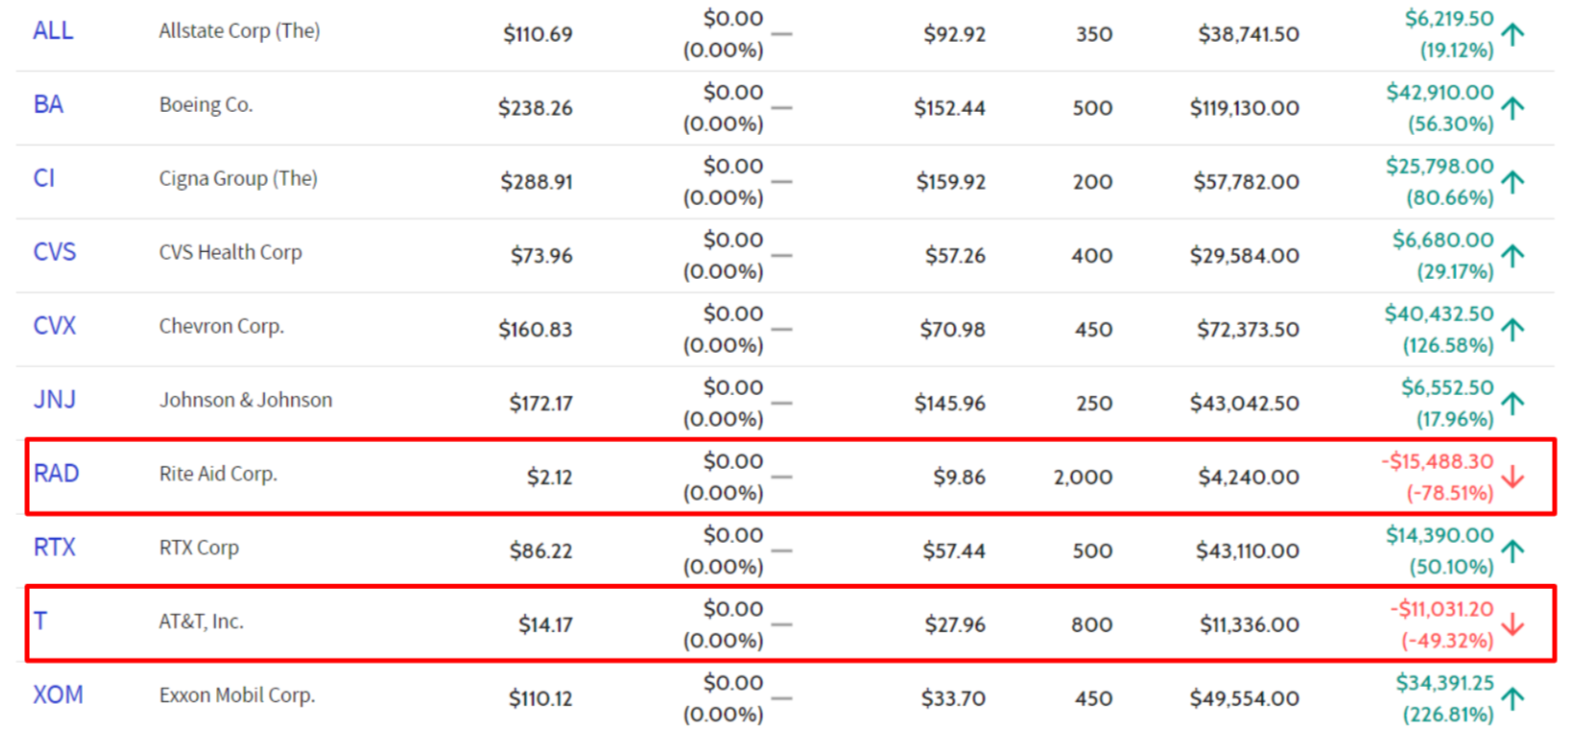
• Use results from my 2020 investopedia stock simulator to help generate the elimination and ranking criteria for all stocks
• Gather, manipulate and organize data on various metrics in excel spreadsheets using Openpyxl, Pandas and Numpy
• Gain experience with working with very large data sets and obtain a better understanding of the financial markets
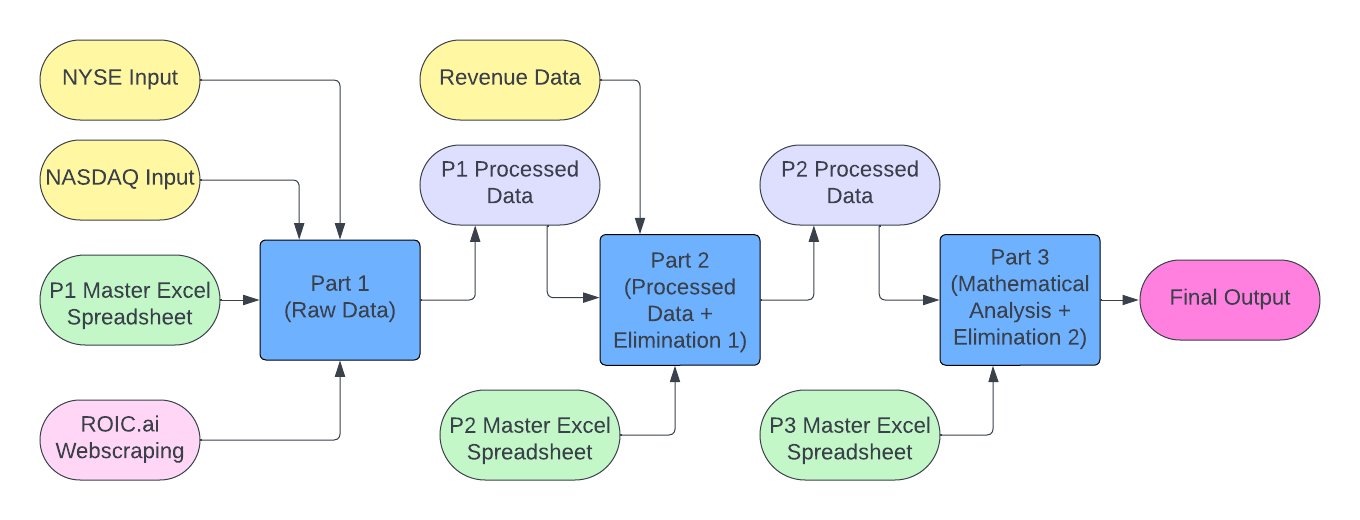
• Part 1 (Data Collection): Takes in input data from NYSE and NASDAQ excel sheets that contain ticker symbols, company names and sectors. Gathers raw data from ROIC.ai and uses the master excel sheet for P1 to place organize the raw data. Stocks that don't have data are added to an error log.
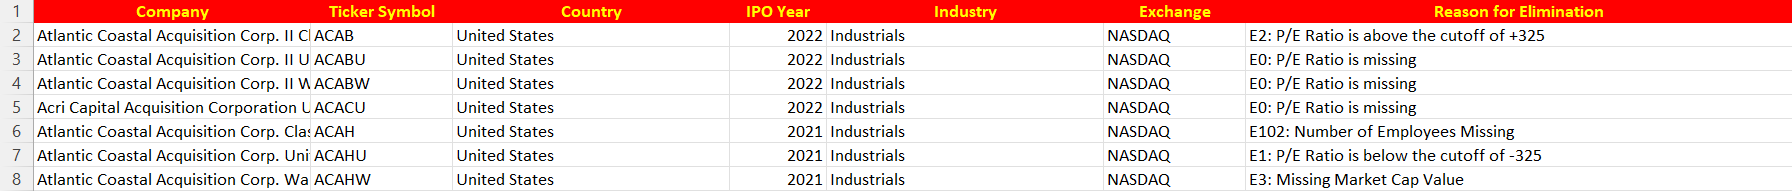
• Part 2 (Data Processing): Further processes the raw data from Part 1 and applies the first of two elimination criteria on some stocks. Stocks that don't make it through are added to an "Eliminated" spreadsheet. Preset revenue data is also added in due to some problems with scraping these values.
• Part 3 (Analysis and Ranking): Mathematical models are applied to the data from part 2 and processed to generate the ranking based on various metrics. A second elimination criteria is applied to reduce the number of ranked stocks to ~1100 in total. Utilizes additional data from Yahoo Finance.
• Identify which factors are the most important when trying to predict the success of each stock based on the data provided above.
• Use the two less desireable stocks (RAD, T) to help identify weaker stocks and ensure that they are not selected in the future.
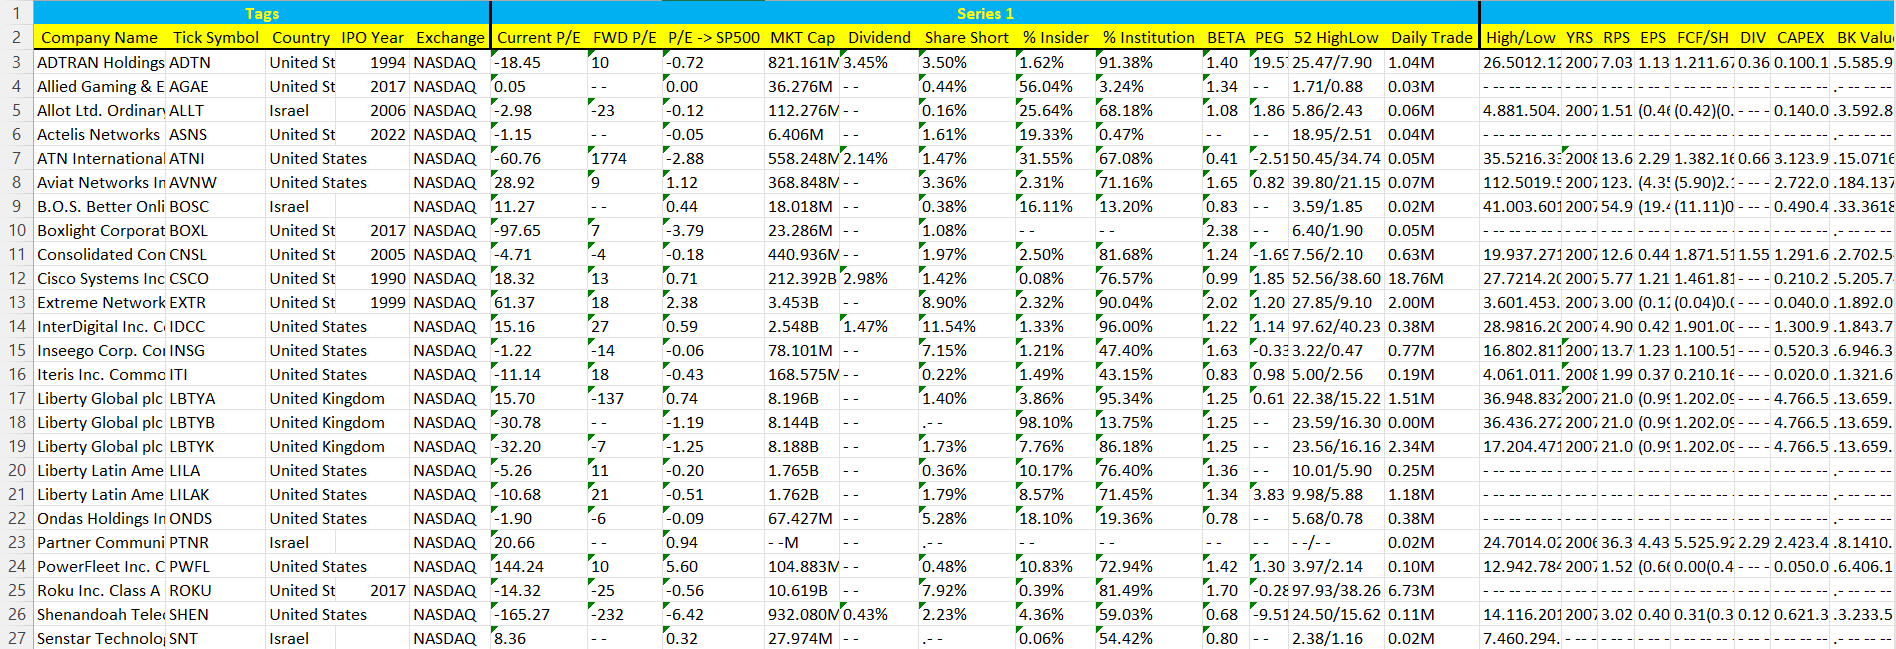
• Given the large amount of data (this image is only a very tiny portion of 1 sheet within the entire excel workbook), it is not a surprise that the program takes quite some time to complete. Part 1 and 2 take about 16 and 14 hours to complete, respectively.
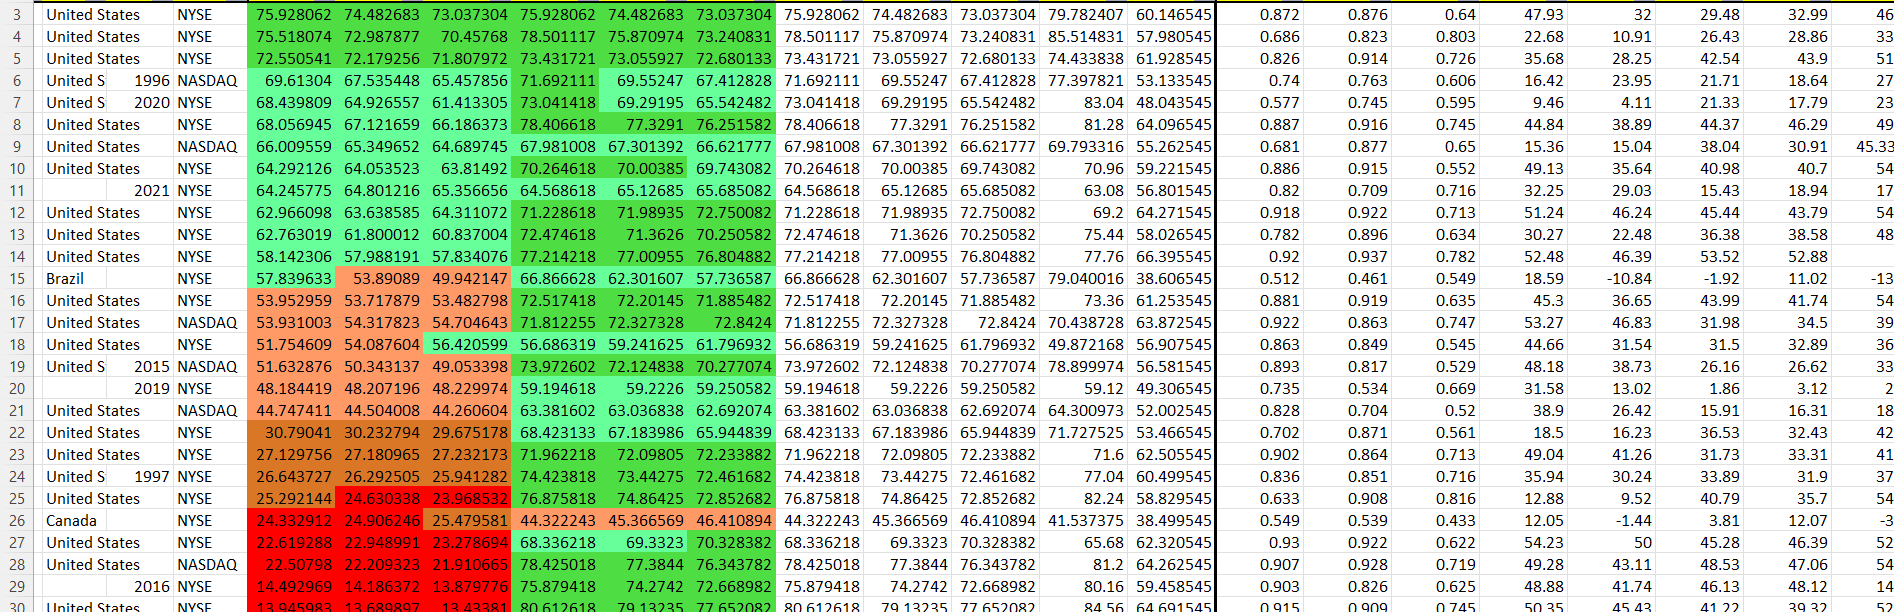
• The left side of the sheet shows values that can be used to determine which stocks to select. Based upon an individual's portfolio goals, a different set of criteria can be used to sort the best options.
• Note: While the selection of stocks could be fully automated, I decided against doing so due to the fact that this was going to be used with real money. The risk of a costly error was too high to let the program do everything itself. As a result, the final decision to select a stock or place an order is done manually with an additional product check to ensure that I am comfortable with investing in the product and/or services being sold.
• Part 1 Failure Recovery: On my initial attempts to run the software, the program ended up failing a few times due to the computer going to sleep or the wifi going out. I wanted to avoid this, so I implemented a failure recovery file that keeps track of the last completed piece of data. All that needs to be done to resume is to copy the values over from the recovery file and toggle a few switches before starting the program again!
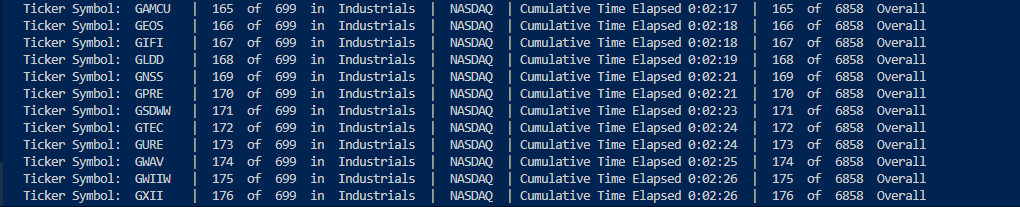
• Debugger + Current Progress Information: Lists the stock currently being processed to confirm that the software has not run into any issues. In the event that an error occurs or the program gets hung, it is very easy to tell which stock the program failed on. Timing for each stock is also included to help identify any anomalies.
• Due to the nature of this project and my goal to continue to implement new investing analysis techniques and strategies, this project will not end here. Over the next few months and years, I will continue to make updates to the various stages of the project to help me make better investments.
• Some additional ideas for improvements include determining the best time to sell given a specific stock or exploring options trading - the latter of which may be split into its own separate project.
Results
• 17 Stocks - 12 Large Cap (77.6% of Portfolio); 5 Mid/Small Cap (16.4% of Portfolio)
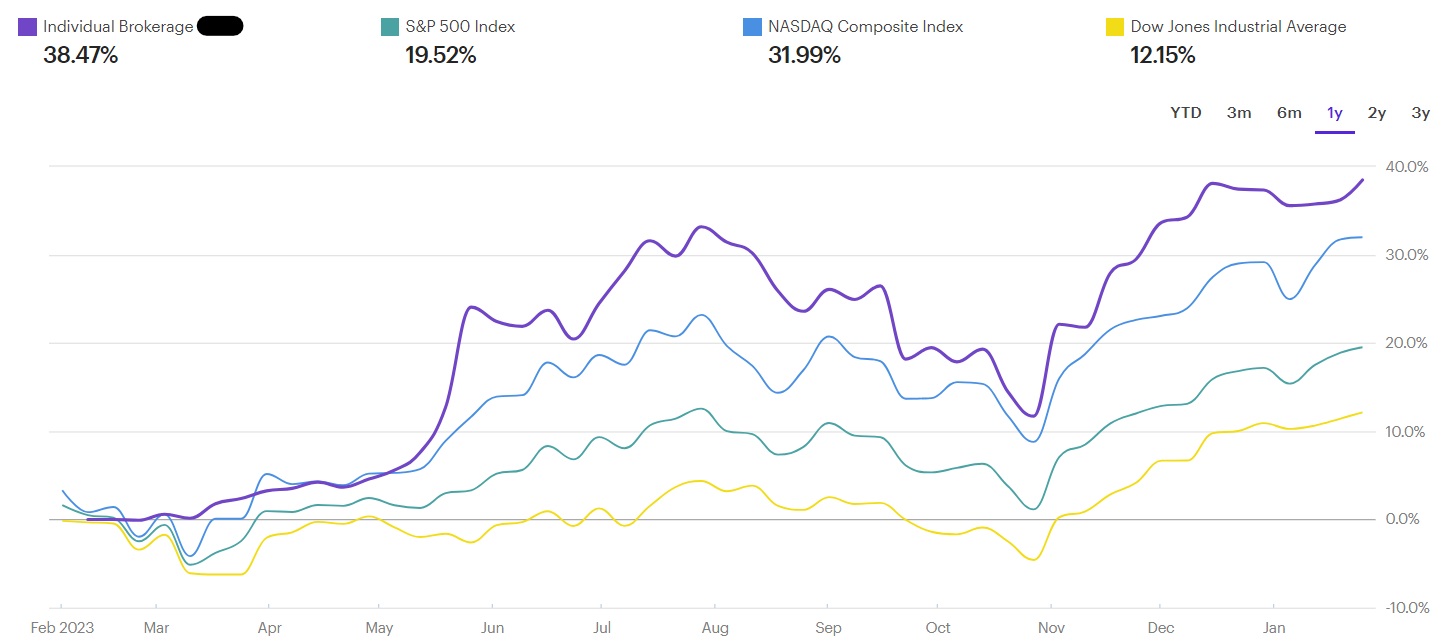
• Here are my current results (purple line) plotted against the three major stock indexes:
If you're interested, check out the source code for parts 1 and 2 here. A portion of part 3 is provided as well.